
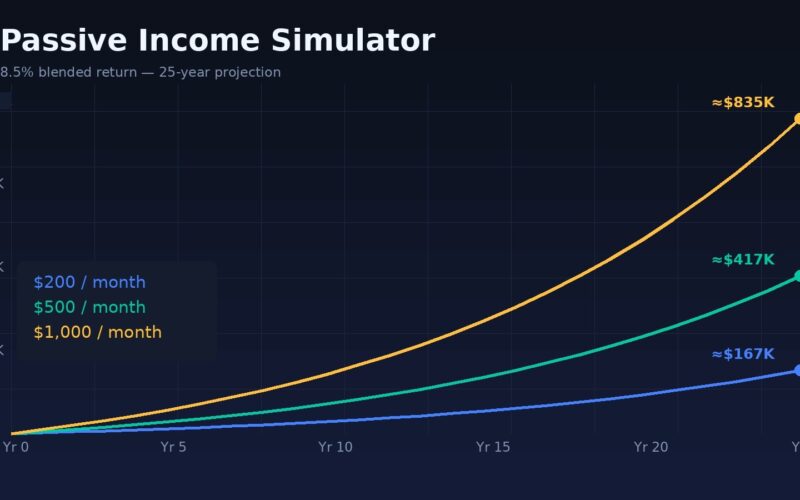
Passive Income Simulator: Run Your Numbers Before You Quit Anything
Most people chasing passive income have never run the math. They see a YouTube video about “$10k/month while you sleep,” buy a $500 course, and two years later they’ve earned $340 total. The fix isn’t more motivation. It’s a passive income simulator — a simple model that shows you, with real numbers, what each income stream actually pays and when.
This article gives you the formulas, the 2026 rates for every major passive income asset, and a worked example you can copy into Google Sheets in 15 minutes. No hype. Just math.
TL;DR: What a Passive Income Simulator Does
A passive income simulator takes four inputs — starting capital, monthly contribution, expected return, and time — and projects your monthly passive income for every year ahead. Run it before you spend a dollar.
The three formulas you need:
- Portfolio income = total invested × annual yield (dividends, interest, rent)
- Growth path = starting capital × (1 + r)^years + contributions × [((1 + r)^years − 1) / r]
- Freedom number = monthly expenses × 12 ÷ 0.04 (the classic 4% rule)
A $500/month investment at an 8% blended return crosses $2,000/month in passive income in roughly year 18. Cut it to year 13 if you add a digital product doing $300/month along the way. That difference — five years of your life — is exactly what the simulator makes visible.
Why You Need a Passive Income Simulator in 2026
Two things changed recently that make guessing even worse than it used to be.
First, yields moved. High-yield savings accounts pay around 4% right now, down from the 5% peak of 2023–2024. Treasury bills yield roughly 3.8–4.2%. The S&P 500 still returns about 10% annually over long stretches, but dividend yields on broad index funds sit near 1.3%. If you built your plan on 2023 numbers, your simulator is wrong by 20%.
Second, “passive” income got noisier. Faceless YouTube channels, AI-written Kindle books, print-on-demand stores, affiliate sites — every one of them is sold as passive, and almost none are. A 2026 LendingTree study found the average side hustler spends 13 hours a week on their “passive” stream. The simulator forces you to count those hours and divide honestly.
Here’s the honest rate table to plug in. These are 2026 figures, not marketing numbers:
| Income stream | Realistic annual yield / return | True effort after setup | Startup cost |
|---|---|---|---|
| High-yield savings (HYSA) | ~4.0% | Zero | $0 |
| Treasury bills / bond ladder | 3.8–4.2% | Near zero | $0 (via TreasuryDirect) |
| Dividend ETFs (SCHD, VYM) | 3.4–3.7% yield + growth | Zero | $0 commission |
| S&P 500 index (VOO, FXAIX) | ~10% total return (long-run avg) | Zero | $0 |
| Rental property | 6–10% cap rate, before surprises | 4–8 hrs/month | 20–25% down |
| REITs | 3.5–5.5% dividends | Zero | $0 |
| Digital products (Gumroad, Etsy) | 50–90% margins, sales not guaranteed | 2–5 hrs/month | $0–30 |
| Affiliate niche site | 0–40% ROI, slow ramp, AI-search risk | 5–10 hrs/month | $50–100/yr |
| Print-on-demand | $2–8 profit per sale | 3–6 hrs/month | $0–30 |
Notice the pattern: the truly passive streams (HYSA, treasuries, index funds) pay 4–10% and require zero hours. The high-margin streams (digital products) require real ongoing work. Your simulator should model each stream’s income divided by its monthly hours, so you can compare a 4% HYSA against a digital product honestly.
How to Build Your Passive Income Simulator in Google Sheets
You don’t need an app. Open a sheet and build four blocks.
Block 1 — Inputs. Row per income stream: starting balance, monthly contribution, annual return, monthly hours required.
Block 2 — The growth engine. For each year n, compute:
= starting × (1+r)^n + monthly×12 × ((1+r)^n − 1) / r
Then passive income for year n = balance × yield. Use the return column for balance growth and a separate yield column for spendable income — with SCHD, that’s roughly 3.5% spendable while total return runs higher.
Block 3 — The honest hourly column. For effort-based streams (digital products, rentals, affiliate), add:
= monthly income ÷ monthly hours
If your Etsy shop makes $400/month and eats 20 hours, that’s $20/hour. Your simulator now compares it against index funds on equal footing — index funds pay $0/hour of effort, which is the whole point.
Block 4 — The freedom line. Add a cell: monthly expenses × 12 ÷ 0.04. That’s the portfolio size where work becomes optional. Then use conditional formatting to highlight the year your projected passive income crosses your actual expenses. That highlighted row is your finish line, in a real year.
The whole build takes about 15 minutes. Run three scenarios side by side: pessimistic (returns cut 30%), realistic, and strong. If your plan only works in the strong scenario, you don’t have a plan.
Three Worked Examples Through the Simulator
Maya, 28, $0 saved, $400/month. She splits $300 into VOO and $100 into SCHD. Blended return 8.5%, blended spendable yield ~1.8%. Her simulator shows $61,000 by year 10 — about $1,100/year in spendable dividends. Not life-changing, but she also spends 3 hours a week on a Canva template shop that clears $180/month. Combined “passive” income at year 10: roughly $340/month. The simulator’s real lesson for Maya: the template shop pays 3x her dividends for the first 12 years. Her leverage is the shop, not the portfolio — yet.
Derek, 45, $120,000 saved, $1,500/month. All-in on a 60/40 stock/bond mix returning a blended 7%. Year 10 balance: about $500,000. At a 3.5% safe withdrawal, that’s $17,500/year — replacing a third of his expenses. Derek’s simulator tells him year 14 is his crossing point, and a 1% return cut pushes it to year 17. That sensitivity is the most valuable cell in the sheet.
Priya, 34, rental curious. She simulates a $280,000 duplex with 20% down ($56,000 plus closing). Rent $2,400/month total, mortgage PITI $1,750, maintenance and vacancy reserve $300. Net: $350/month on $62,000 deployed — a 6.8% cash-on-cash return, with 6 hours/month of landlord work. The simulator prices her time at $58/hour-equivalent… which beats her HYSA at 4% but requires her to actually be a landlord. Now she can decide with numbers instead of vibes.
What the Simulator Says About Stacking Streams
Run enough scenarios and one pattern repeats: single-stream plans are fragile, stacked plans are resilient.
Take two savers with identical $600/month to invest. Saver A puts everything into an index fund at 8%. Saver B splits it — $400 into the same fund, $200/month of effort into building a Notion template shop that reaches $500/month in sales by month 14 (Gumroad’s 10% fee and roughly a 2% refund rate already included).
By year five, Saver A’s portfolio throws off about $95/month in spendable income. Saver B has a smaller portfolio paying $63/month — plus $500/month from templates at maybe 4 hours a month of upkeep. B’s total: $563/month, nearly 6x A’s, and the gap holds until the portfolio gets big.
But here’s what the simulator adds that the hustle bros skip: fragility. Notion could change its template marketplace terms. Gumroad could raise fees. AI search could gut template discovery. Model a 40% revenue drop in B’s shop and her income falls to $363/month — still ahead, but no longer untouchable. A’s $95/month is close to bulletproof.
The practical read: use effort-based streams to buy speed, use portfolios to buy certainty, and size each stream so that no single failure breaks the plan. If one stream covering your rent depends on one platform’s goodwill, your simulator should flag it red — because it will eventually be right.
The Mistakes Your Simulator Will Catch
Counting total return as income. A 10% S&P 500 return is not spendable income unless you sell shares. Your income column should use dividend yield (or a withdrawal rate), never total return. Mixing these up inflates projections by 3x.
Ignoring the ramp. Digital products, affiliate sites, and YouTube channels earn close to zero for months. Model year one at 25% of your hoped-for revenue and ramp up 20% quarterly. If the plan dies without the ramp assumption, it was never alive.
Forgetting taxes. Dividends and interest are taxed every year (15% for most people on qualified dividends, ordinary rates on interest). Inside a Roth IRA or via treasury interest (state-tax-free), the drag disappears. Your simulator needs a tax column, or your freedom number is off by a quarter.
Calling semi-passive “passive.” A rental is a part-time job with leverage. A faceless channel is a content business. Both can be great. Both belong in the hours column. The word “passive” should be reserved for streams that pay the same whether you log in or not.
Actionable Takeaways
- Build the four-block simulator tonight. Fifteen minutes in Google Sheets, and every financial decision after it gets sharper.
- Plug in 2026 rates, not 2023 rates. HYSA ~4%, SCHD yield ~3.5%, treasuries ~4%, S&P long-run ~10%.
- Give every stream an hours column and an income-per-hour figure. That single column kills most bad ideas before they cost you money.
- Run pessimistic, realistic, and strong scenarios. Only trust plans that survive the pessimistic one.
- Front-load the effort-based streams early (digital products, templates), and let the portfolio compound behind them. The shop pays this decade; the dividends pay the next one.
FAQ
What is a passive income simulator?
It’s a spreadsheet or tool that projects how much monthly income your investments and semi-passive projects will generate each year, based on starting capital, contributions, yield, and time. It turns “financial freedom someday” into a specific year and dollar figure.
How much money do I need for $1,000/month in passive income?
At a 4% yield, $300,000. At SCHD’s ~3.5% dividend yield, about $343,000. With a digital product doing $400/month, you only need $600/month from investments — roughly $180,000–$205,000. Stacking a semi-passive stream cuts your required capital by a third or more.
What’s the most realistic passive income for a beginner?
A high-yield savings account and an index fund. Boring, but zero hours and zero scam risk. Every dollar at 4–10% compounds while you sleep, and the simulator shows you exactly when it turns into real monthly income. Everything higher-yield costs either hours or risk — usually both.
Are rental properties really passive?
No. Even with a property manager (typically 8–10% of rent), you’ll spend 2–4 hours a month on decisions, vacancies, and repairs. Self-managed runs 4–8 hours. Treat rentals as a leveraged part-time business that happens to pay you every month — and model the hours in your simulator.
Should I use a free online simulator instead?
You can — josafa.com.br and fincheck.it both have simple ones, and any FIRE calculator handles the portfolio half. But most don’t model effort-based income streams or hours. Build the sheet yourself once and you’ll understand your own numbers better than any tool can show you.
Related calculators: side hustle income calculator · AI freelance rate comparator · side hustle income tracker
State-by-State Salary Benchmarks
Wondering how your side income stacks up against full-time pay where you live? Check real salary data for your state: